How do you challenge yourself as a teacher? I’ve been working on making my pedagogy more powerful by pushing lessons forward with STEAM. Originally known as STEM (Science, Technology, Engineering, and Math), STEAM introduces the Artistic element to the closely related fields. When you are teaching a STEM subject, it is common to integrate more than one letter of the acronym (Hertz, 2016), but one of my modus operandi is to try to incorporate as many of the letters as possible into any given lesson. Powering my teaching with as much STEAM as possible is an art form to me.
Some lessons are more successful at incorporating all five letters of STEAM than others. A recent math lesson got my creative juices flowing, and turned into a beast of learning for my 4th grade gifted students. It all began with an enrichment lesson from Ready Math.
Fourth graders had been reviewing place value as well as adding and subtracting large numbers. This is the perfect example of a math concept becoming boring for advanced students, those who have shown mastery of the subject matter. Once these kids conquer the use of algorithms, plugging in numbers to get sums and differences becomes mindless. Adding and subtracting is like riding a bike. Why make them pedal a stationary one when we could take it on a trip, instead? This is where I come in.
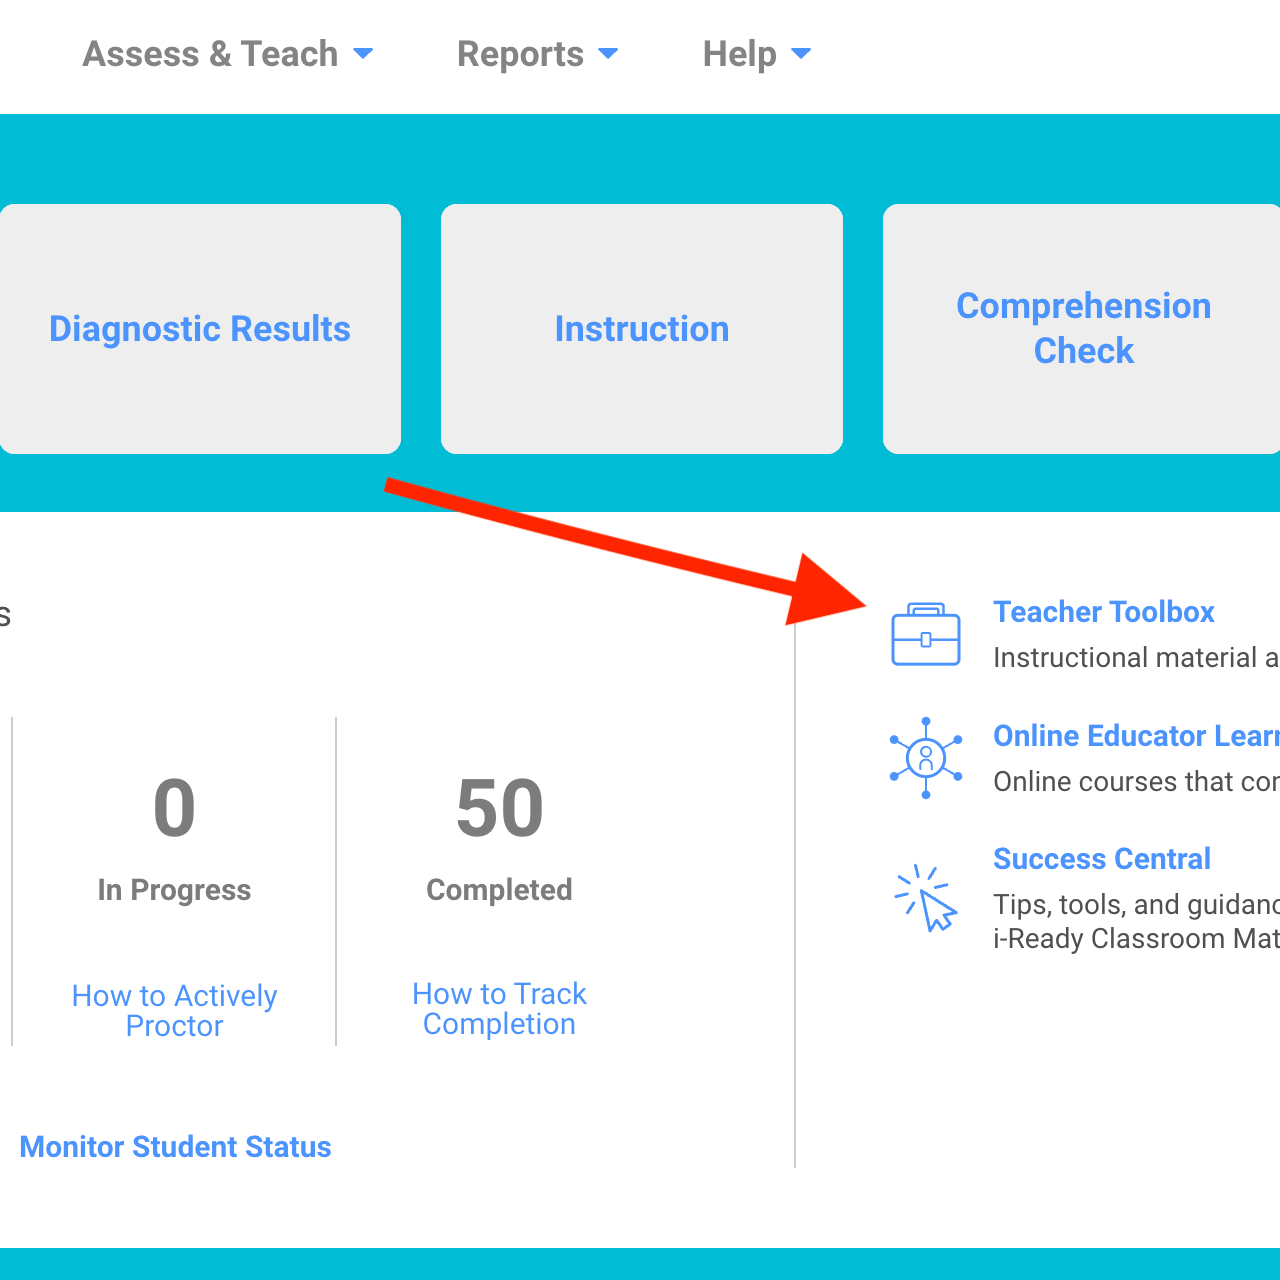
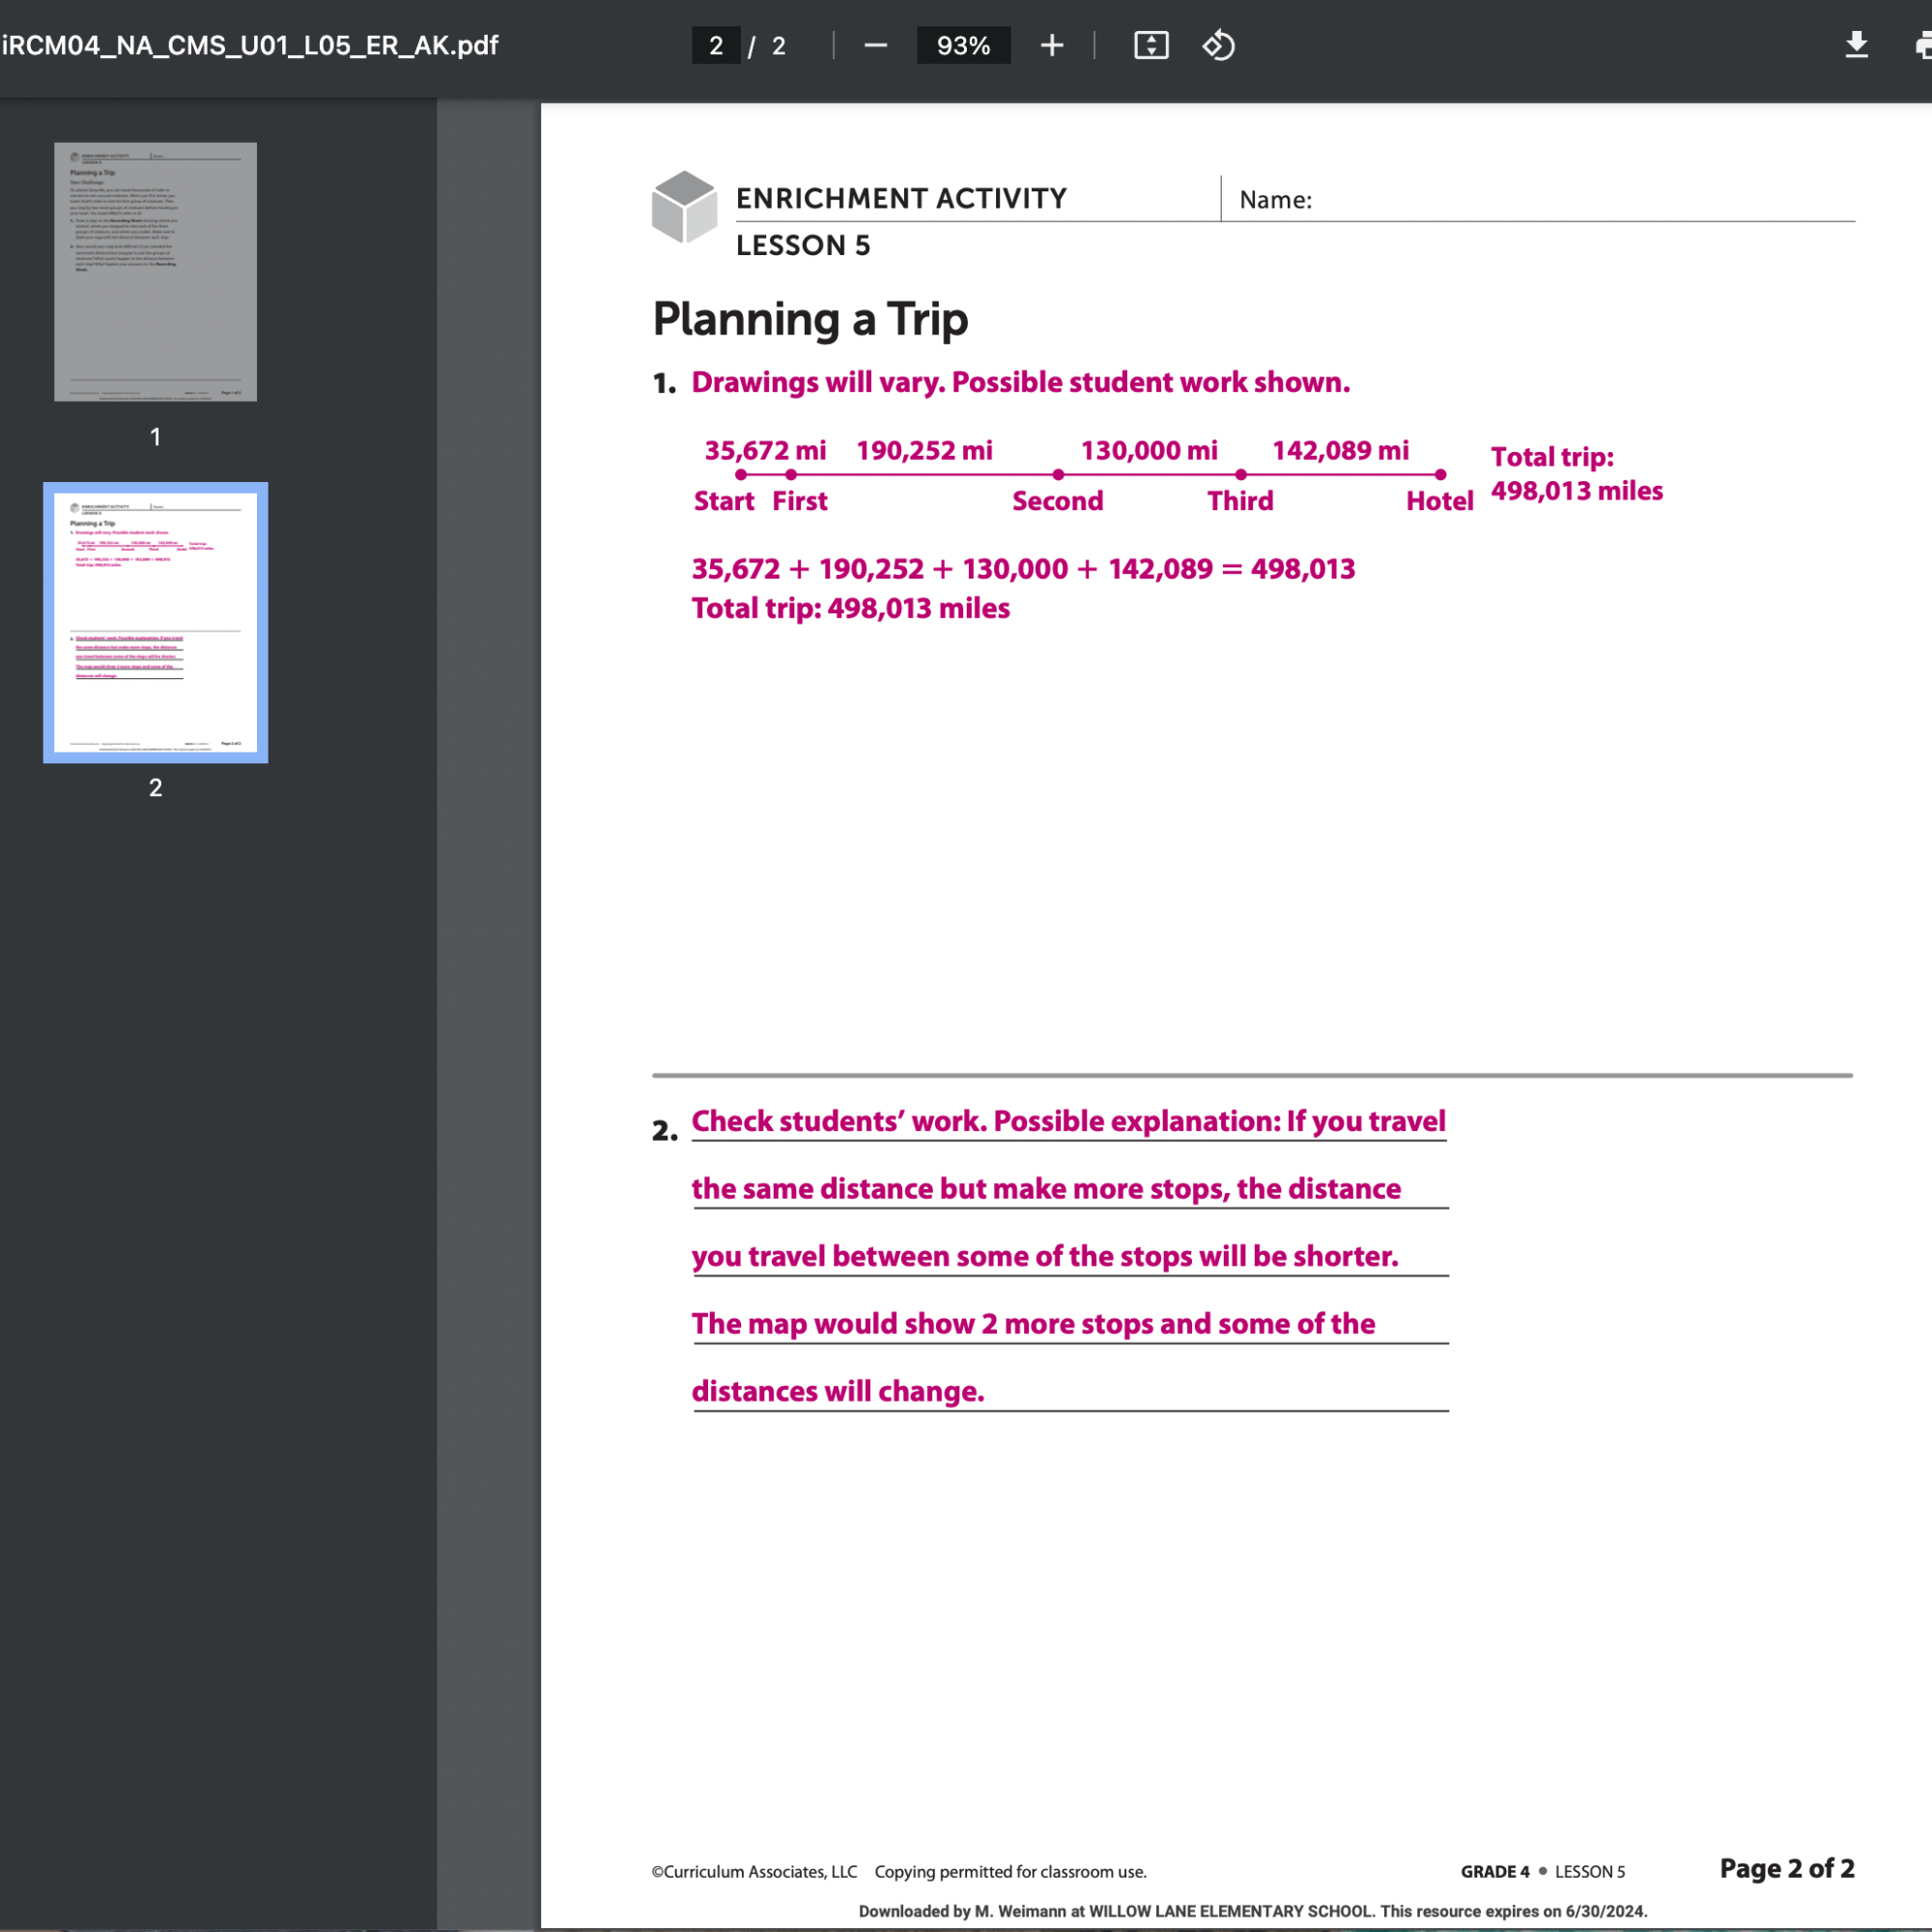
My first stop on developing math enrichment lessons is to check out the iReady Teacher Toolbox for ready-made resources that I may build upon. Curriculum Associates, the makers of Ready Math, has developed an enrichment assignment accompanying nearly every lesson. These are worksheets that can be printed for students to work on independently. You can push the assignment out digitally via Google classroom, too. The Ready Math team has provided a “Teacher Version” that contains answers; Even potential answers to open-ended questions, so that teachers know what to expect!

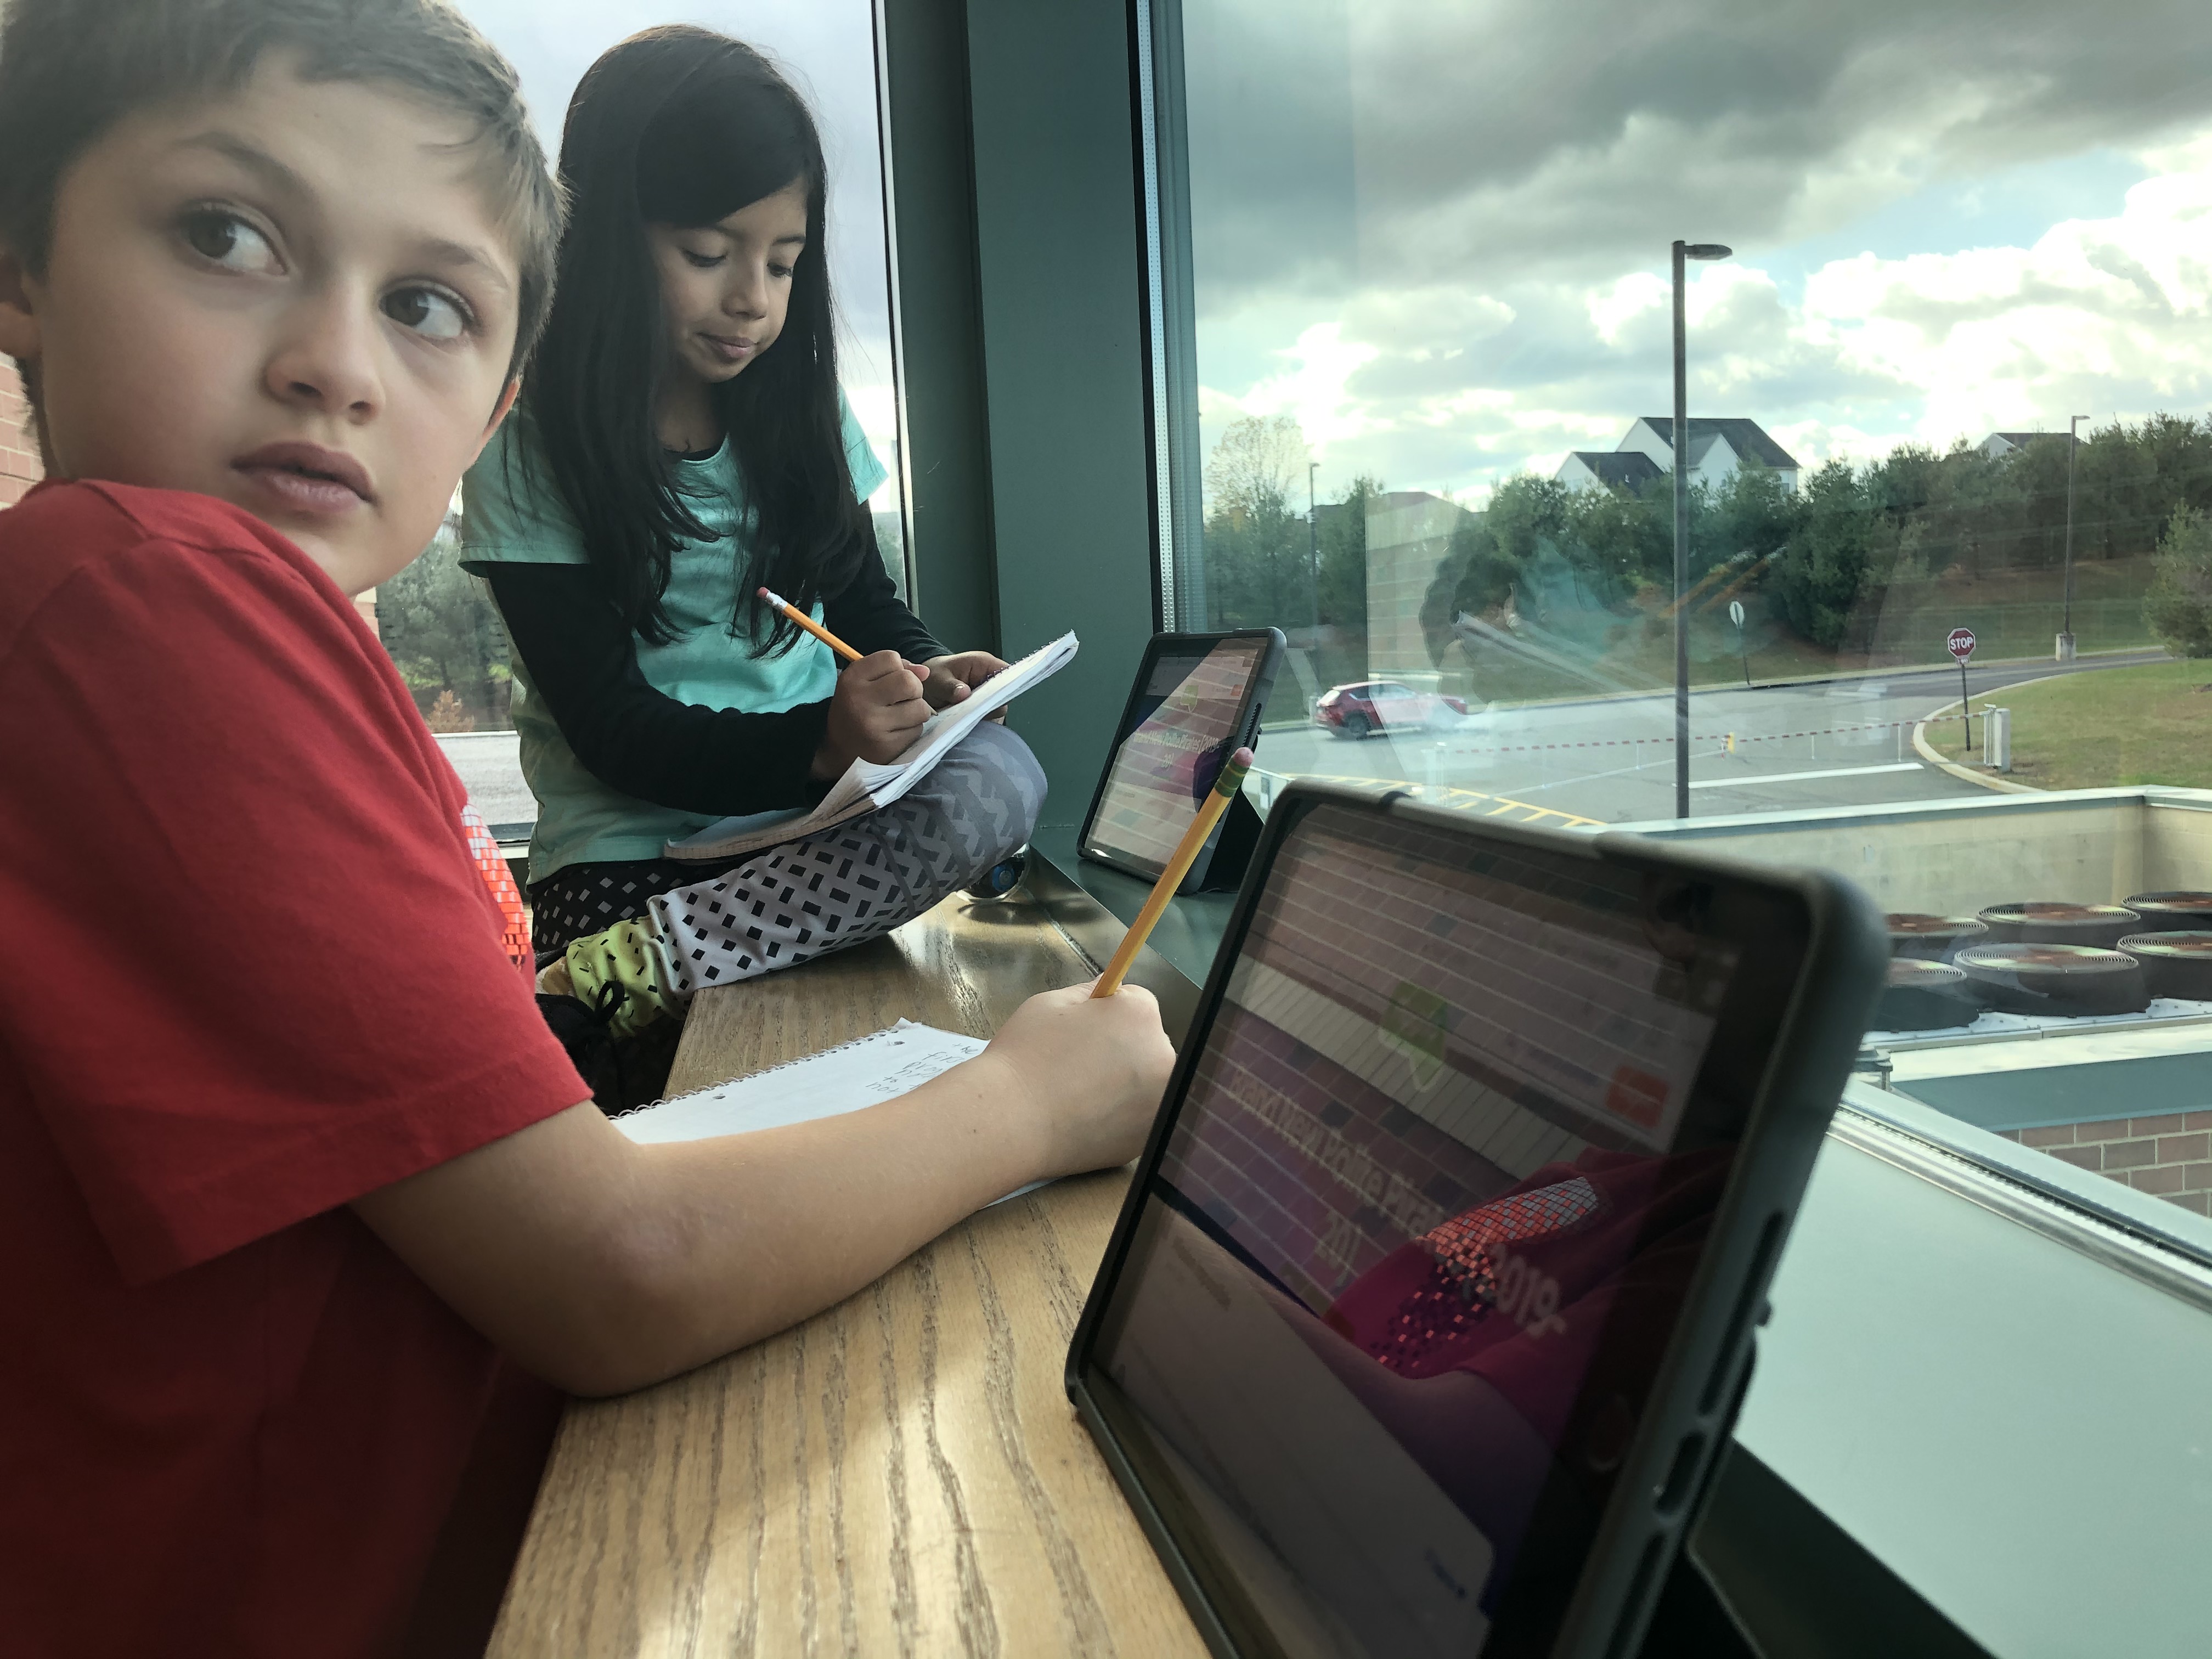
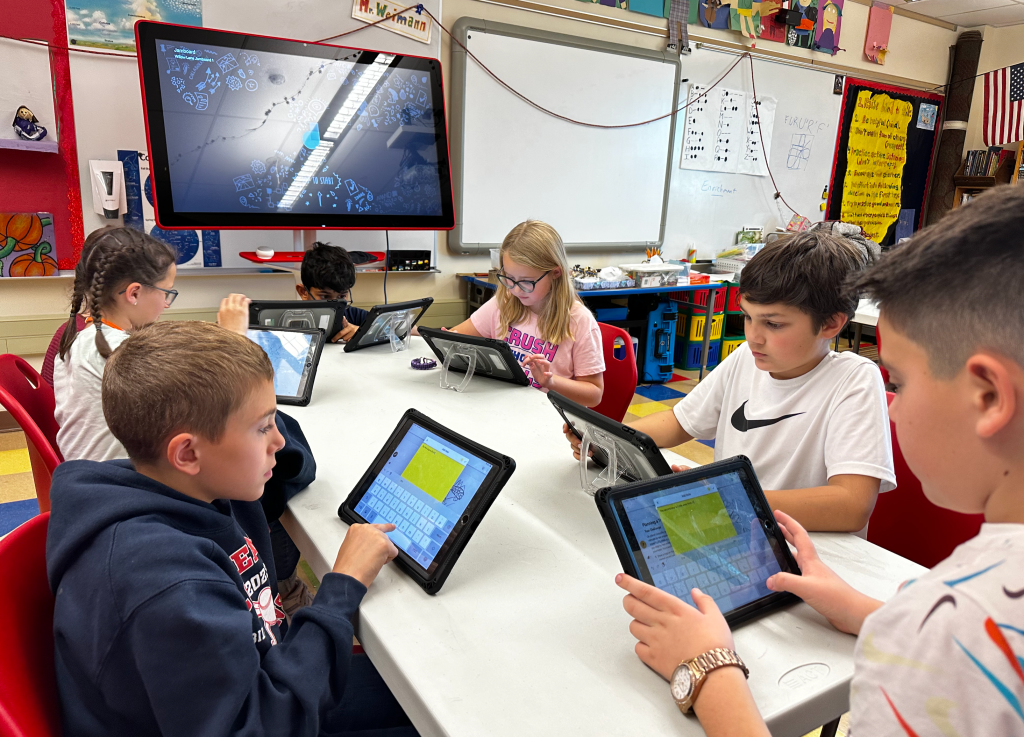
For this lesson, I took a screenshot of an iReady enrichment assignment, and used it as the background of a Google Jamboard. I like Jamboards because my students can draw and write on their iPads. They can create new blank slides, as well as duplicate the one with the instructions on it. It is easy for me to make a template, and then create a copy for each student through Google classroom.
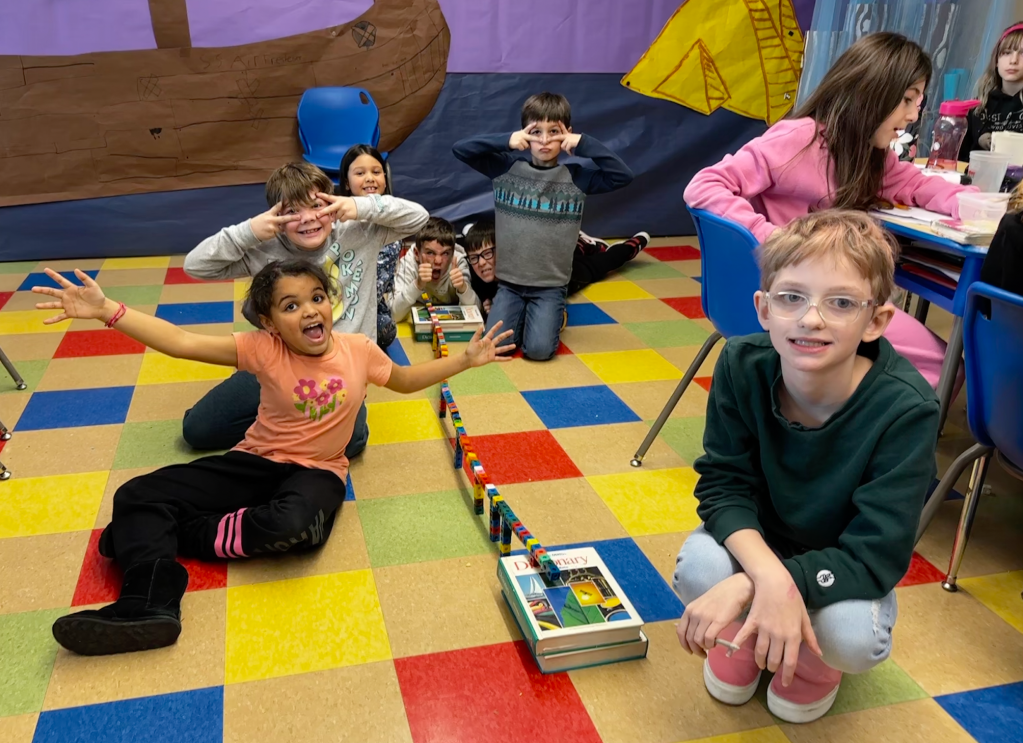
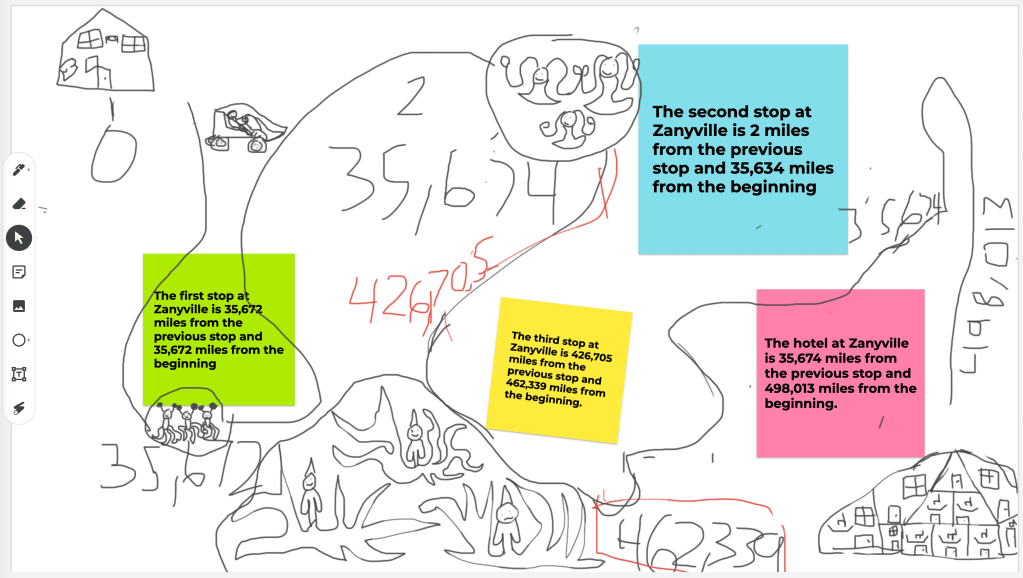
This zany lesson, “Planning a Trip,” had students pretend to explore an imaginary planet, Zanyville. It introduced gigantic numbers and was very open-ended. I included some more instructions that I shared orally, when I initially rolled out the project. “You must tell me the number of miles from the beginning of the trip where each of the stops happen. Also, you have to provide the distance between the stops.” Students were instructed to use “sticky notes” in Jamboard to share this information. They showed their work on other slides.
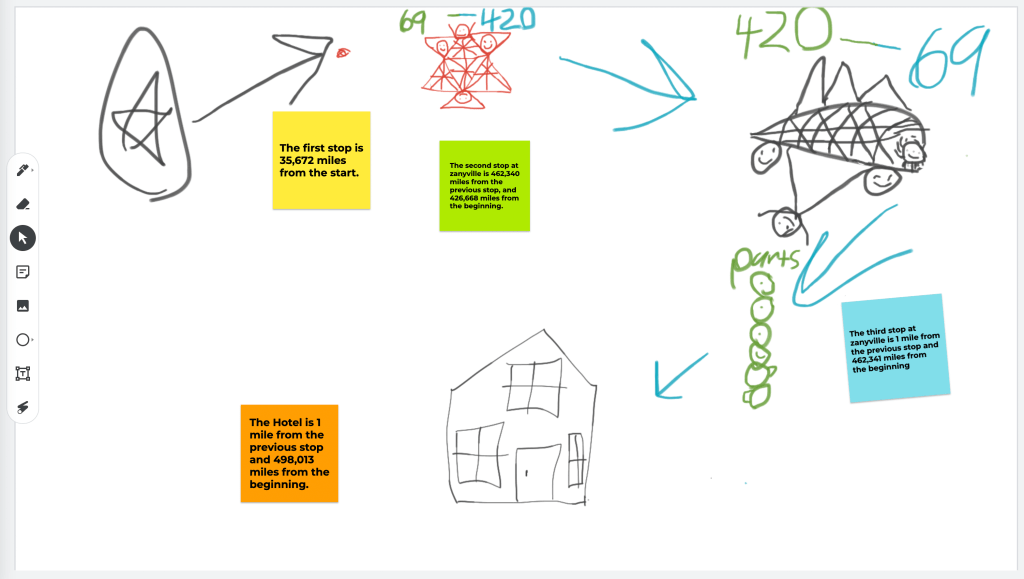
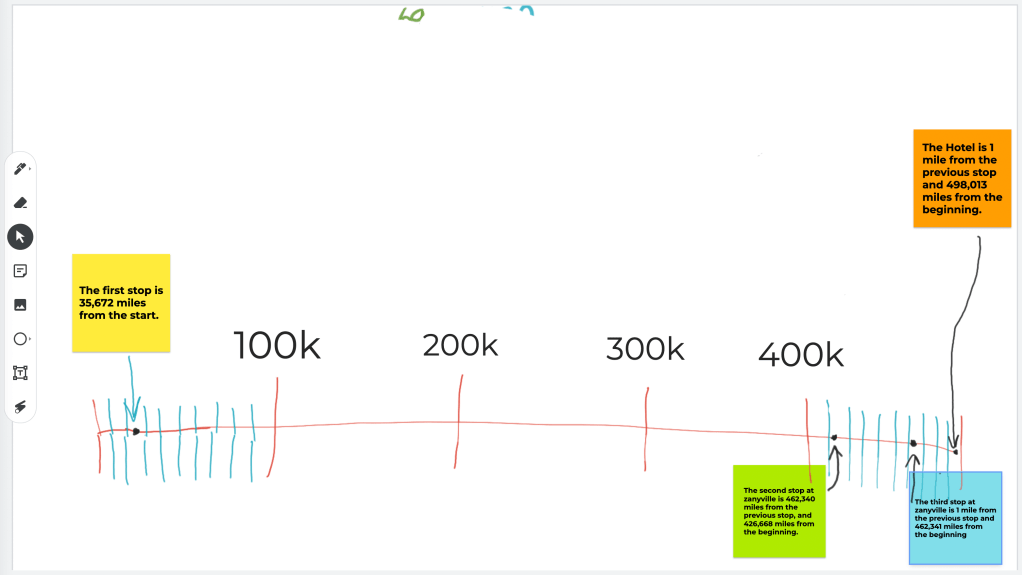
The 4th graders worked hard and were engaged in making their maps. Only, the maps were grossly disproportionate. Some students made the third stop only “one mile” from the end of the trail, but placed it a fifth of the distance from it along the route they drew in their Jamboard. In actuality that distance would represent tens of thousands of miles! It is true that I did not instruct students to partition their maps with accuracy, but when I witnessed the misuse of proportion, I saw a fertile opportunity for learning. Enter, STEAM!

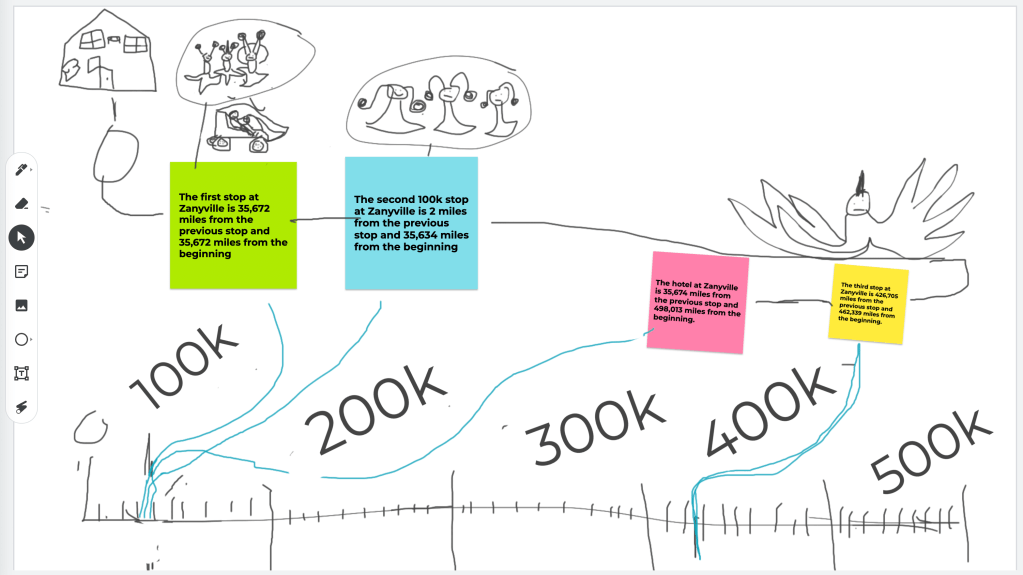
The next time that I met with the 4th grade math enrichment students, I taught them proportionality. There weren’t any Ready Math lessons on this, but it fulfilled my mission for the enrichment group perfectly! My vision for enrichment is to deepen students’ understanding on math concepts. We do not rush ahead or necessarily “do more” math. I try to present novel ways of using the concepts that students are learning in the classroom. Sometimes, lessons include real-world problems, using the math that they are learning to perform a task they will most likely encounter some day. Other times, we may play a game that requires students to view the numbers in a unique way. In this instance, I wanted my enrichment students to learn about the relationship (ratio) between numbers.
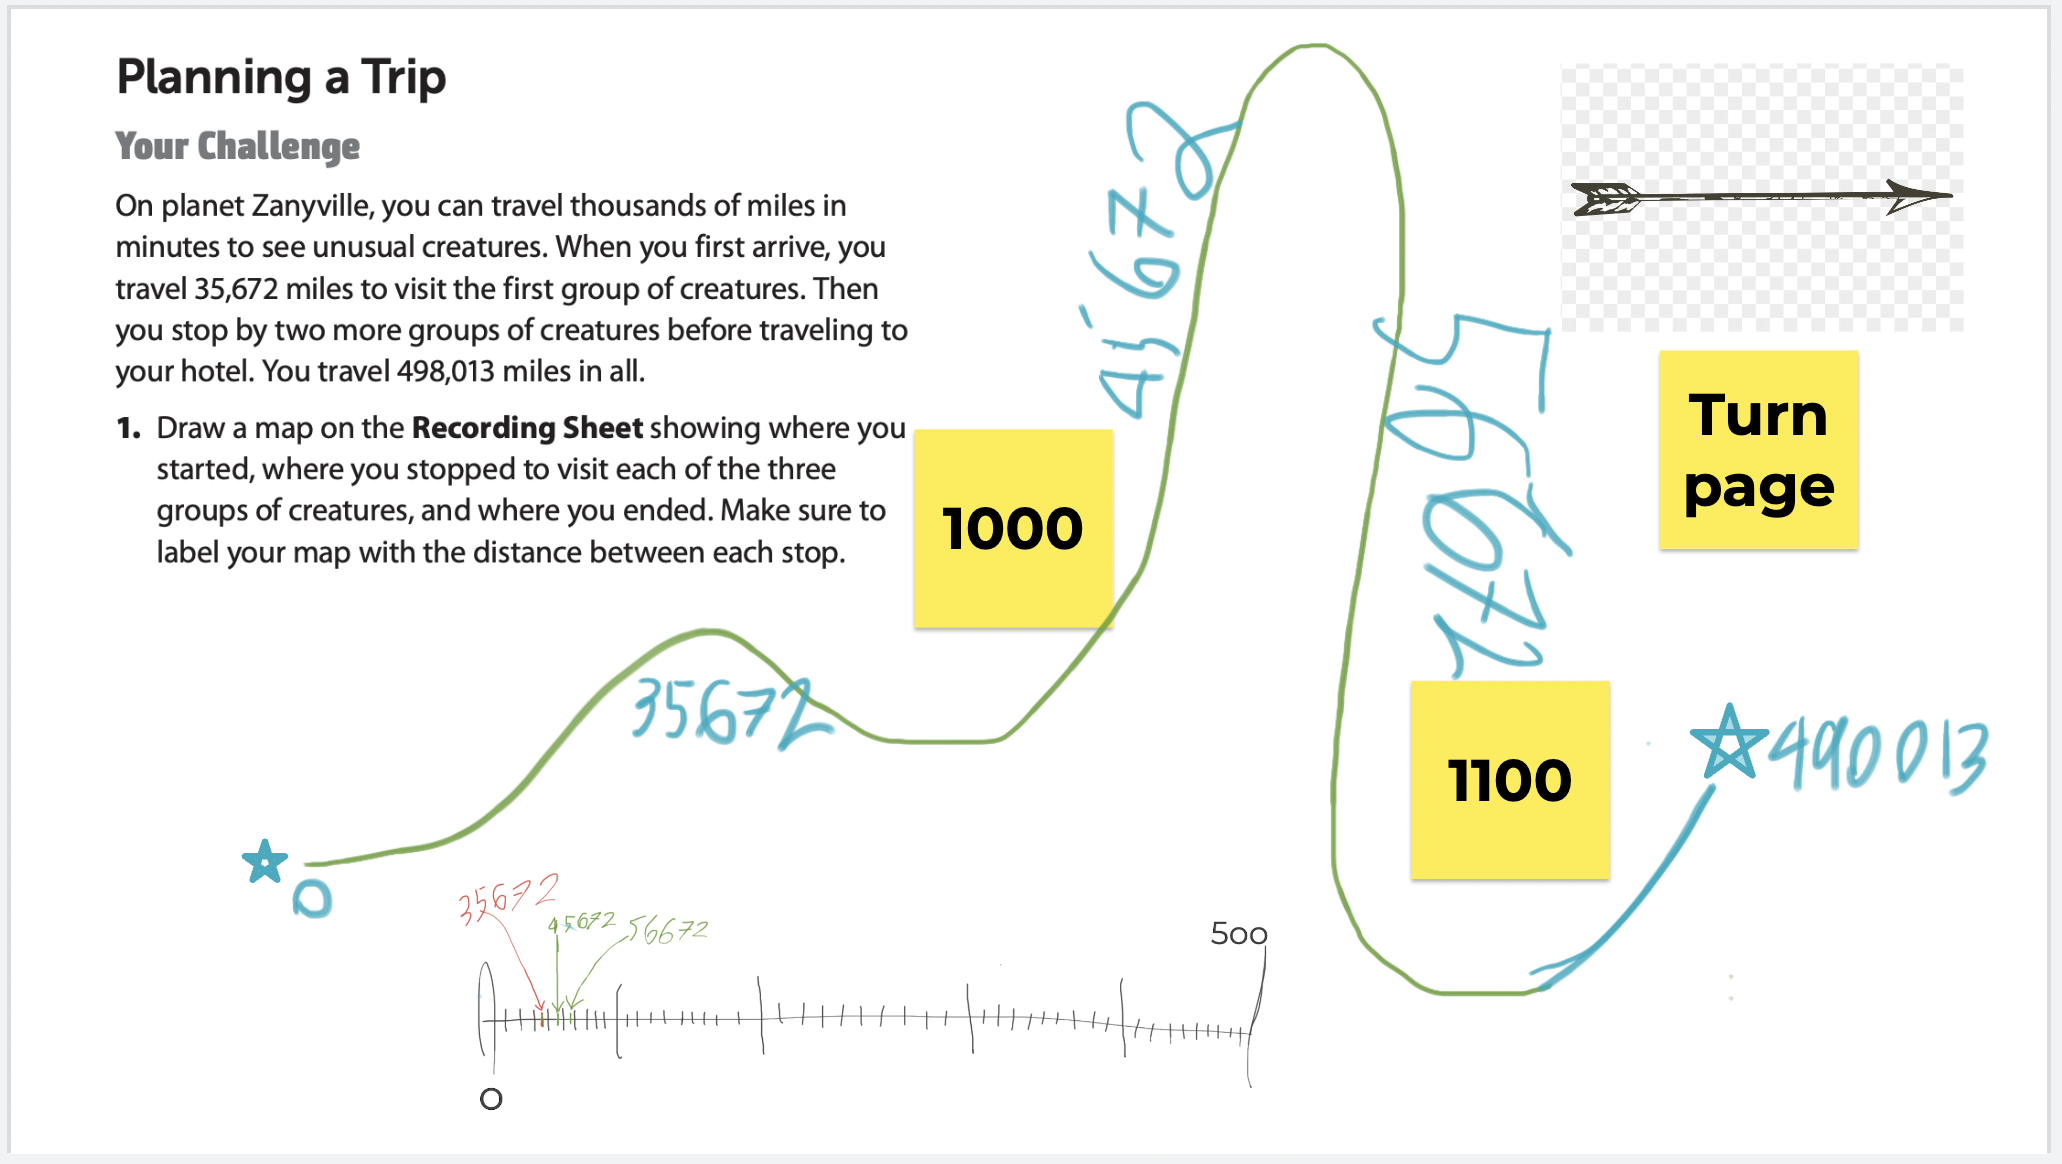
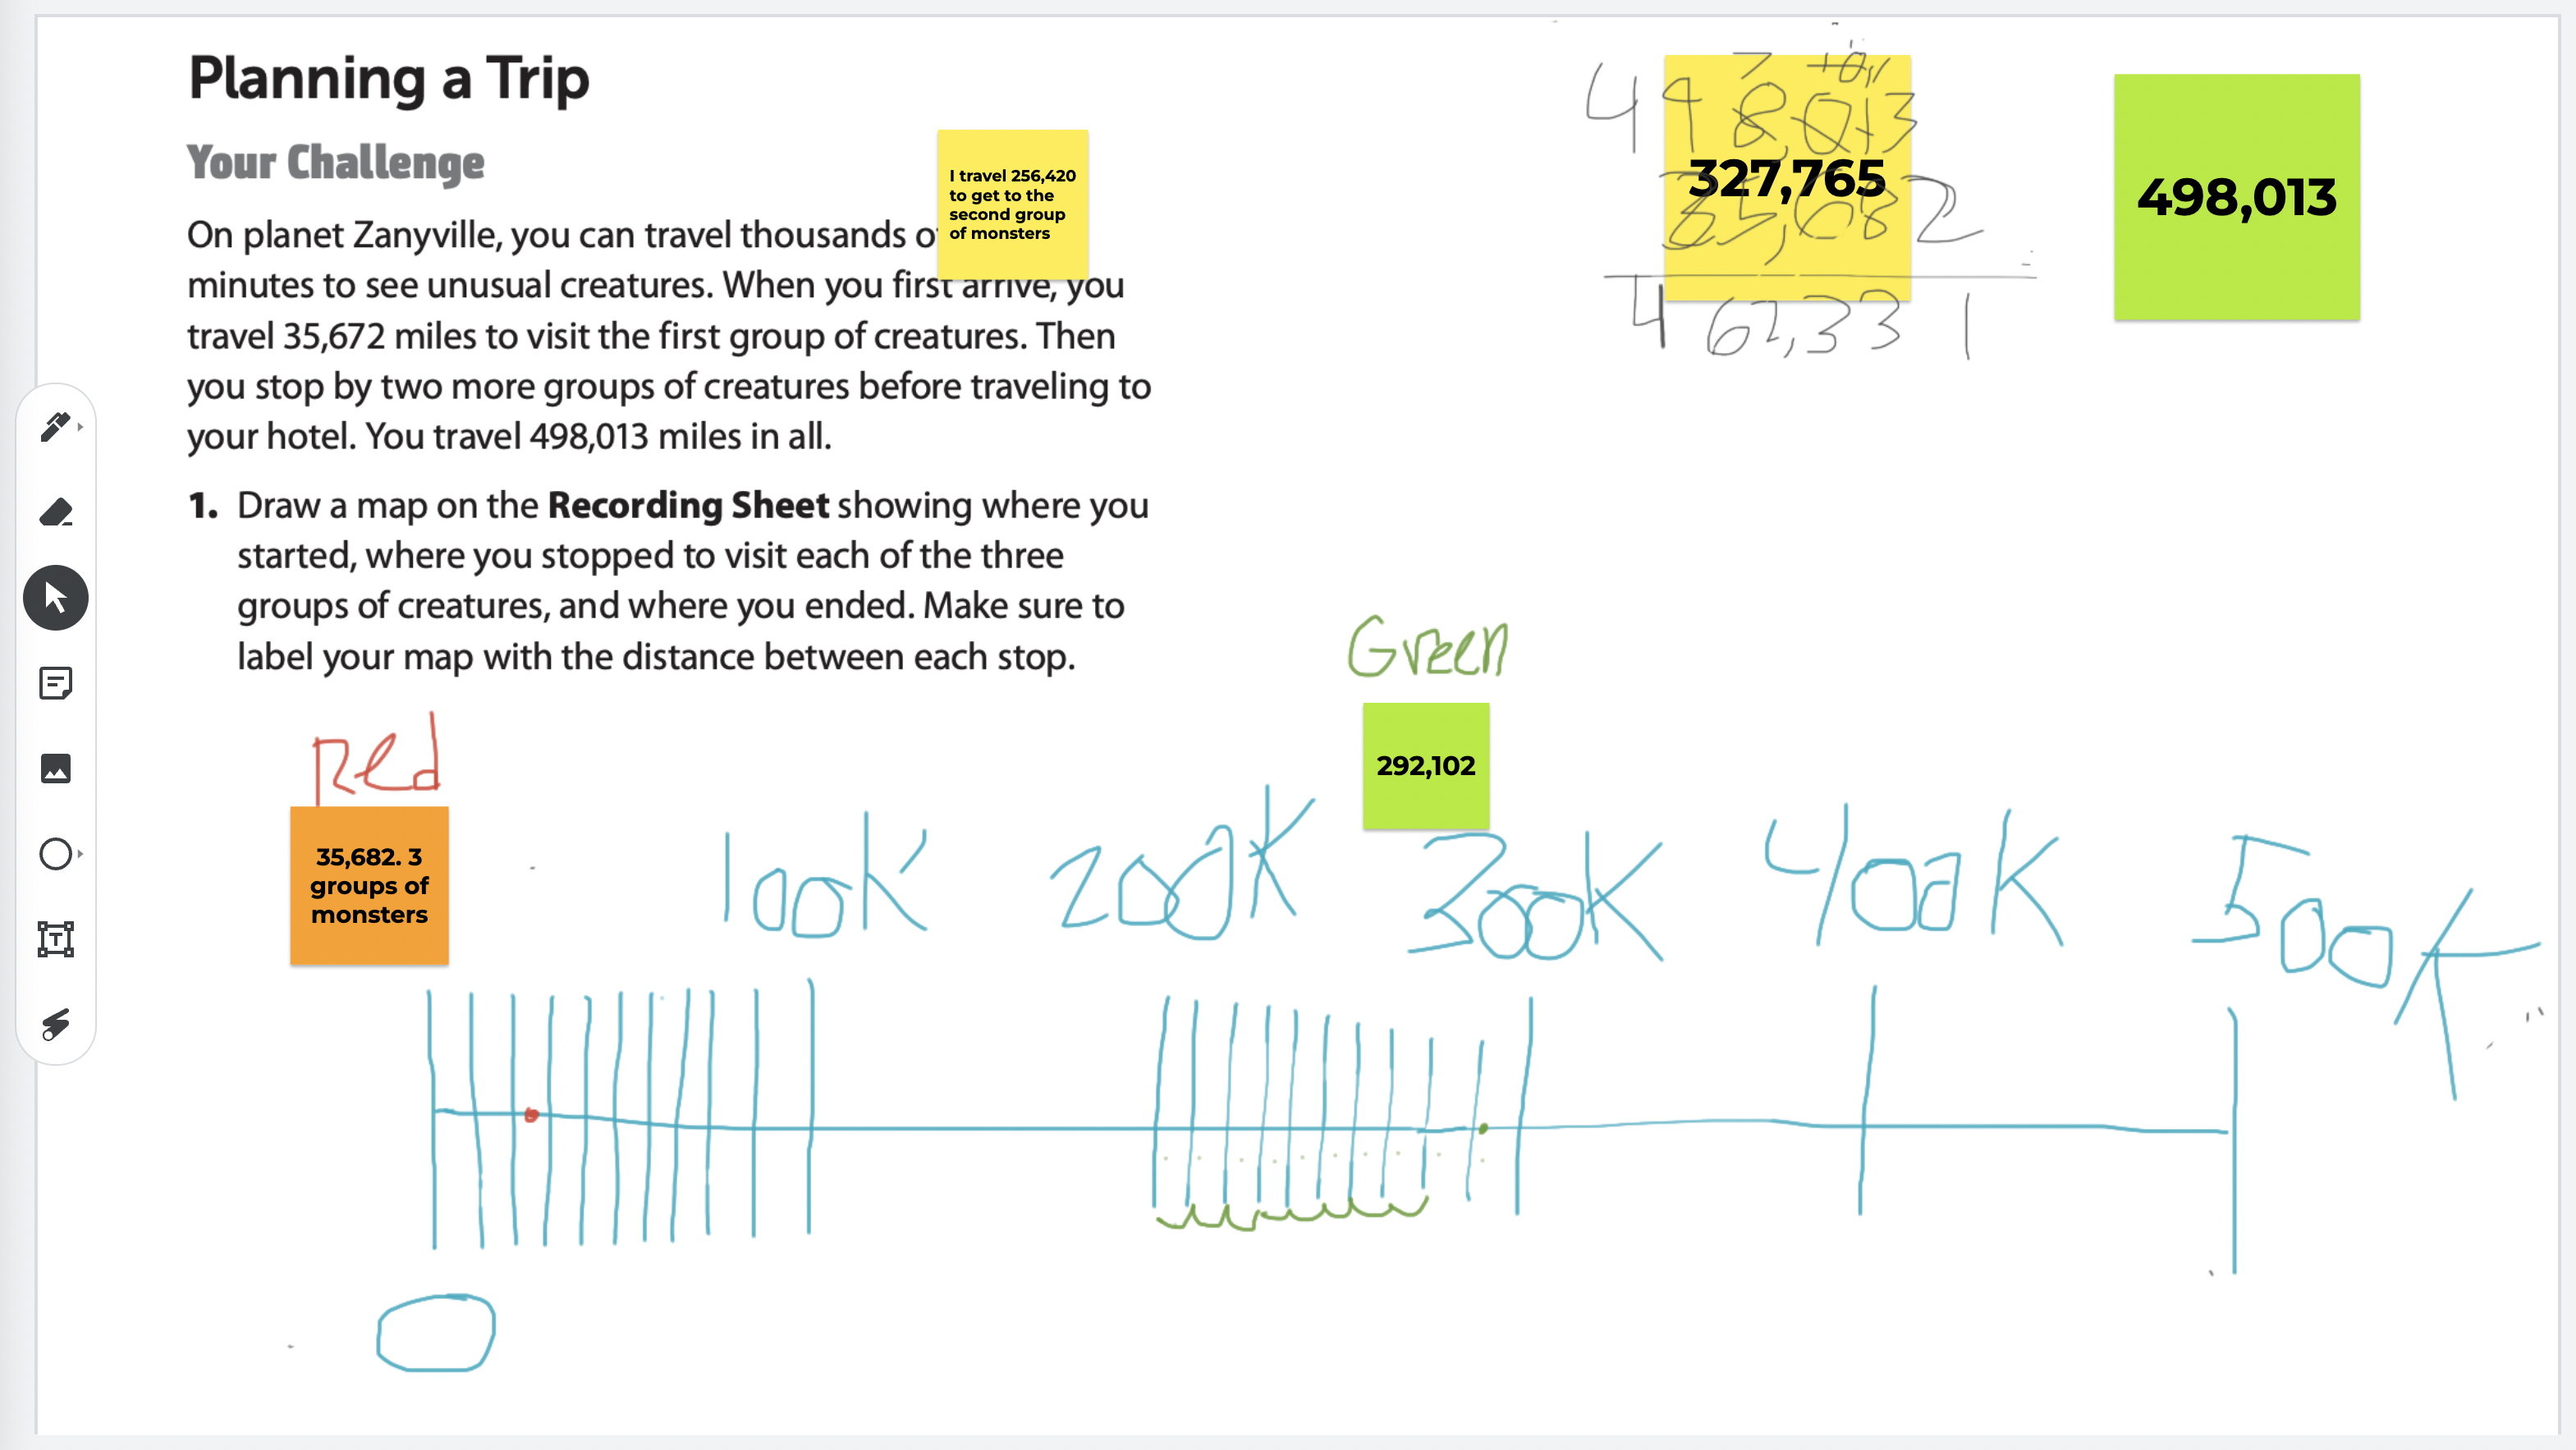
I modeled partitioning a space on the whiteboard. With students’ input, I placed numbers in appropriate places on the makeshift number line. After a short lesson on this, I had students revisit their “Planning a Trip” lesson from the previous week. They were to make a number line and show where each stop would happen. Their Google Jamboards showed excellent progress in understanding this concept.
From Enrichment to Gifted Instruction
This is where the lesson took a turn from enriching math understanding to present problem-solving and higher-order thinking through gifted instruction. In order to illustrate the disproportionality of the original maps, I’d have the gifted 4th graders use one of their own to display an accurate account of the journey.
How would we do this? I would lift the trail from the map. The trail would become a rope that could rise up off of the map. This would allow my gifted students to account for extra mileage and figure out how someone may have covered the distance of tens of thousands of miles, but look, from only glancing at a two dimensional map, as though they had only hiked a handful of miles. My plan was for the fourth graders to learn about topography.
I gave my students a rope that was about 50 feet long. Their initial task was to tie pieces of yarn onto the rope symbolizing stops on the trip. They used what they had learned from the previous math enrichment lesson to do this.
“If the entire trail was 498,013 miles (this was on the planet Zanyville, remember), and the first stop was only 35K miles from the start, you couldn’t mark it halfway along the journey!” I reminded them.
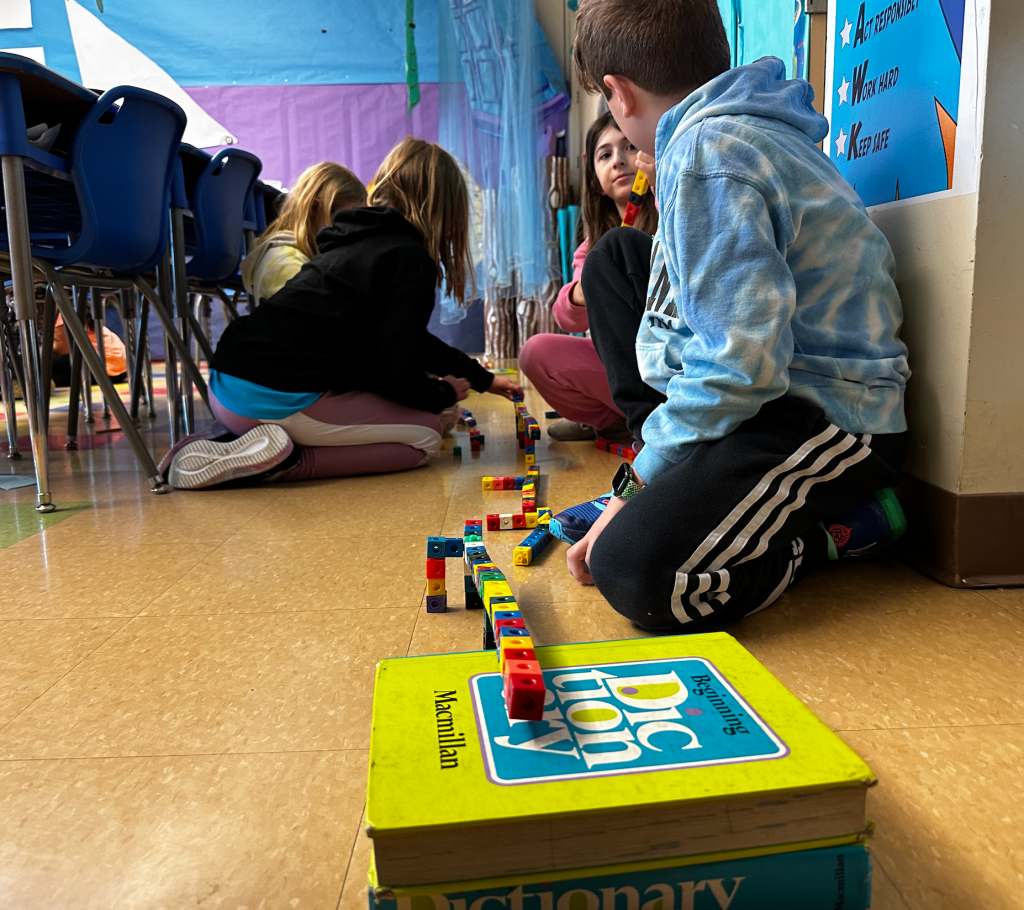
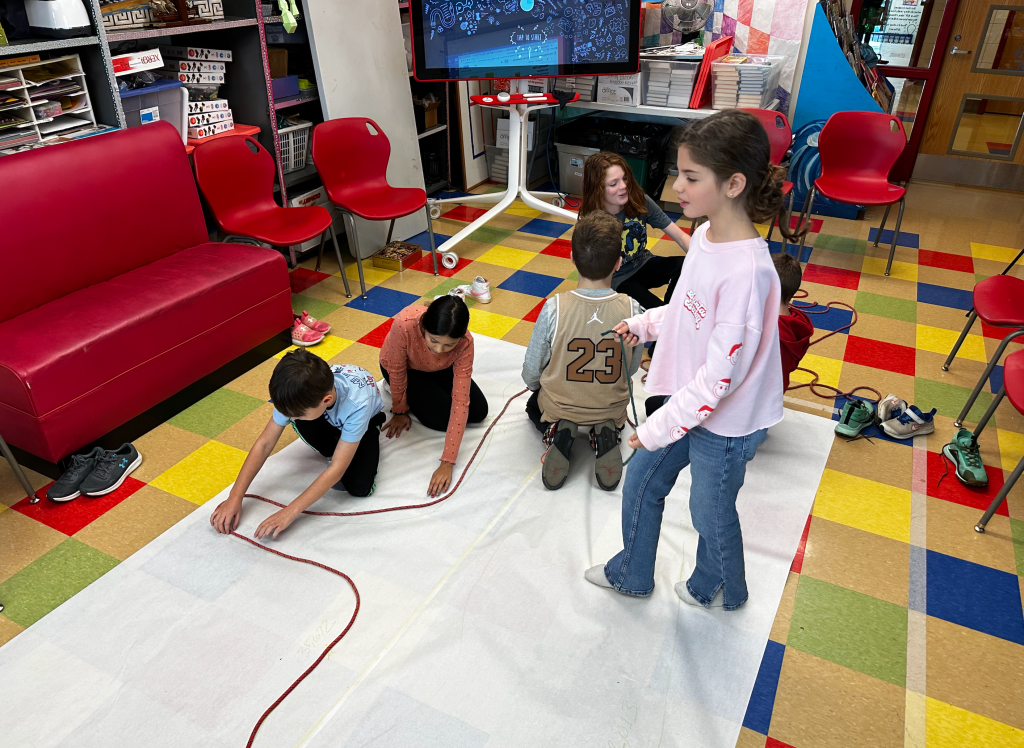
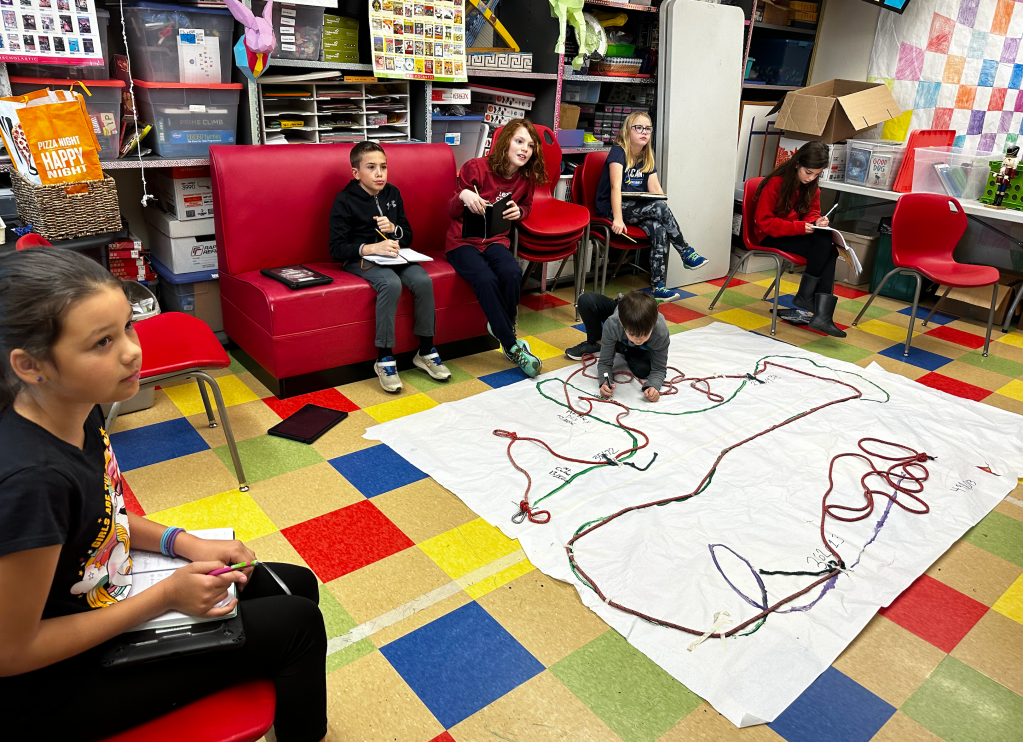
We brought the rope into the hallway, so that we would have plenty of room to #STEAM. The first thing my students did was section the rope into five equal parts. It being a 50 foot rope, each of the five sections was ten feet. As it turns out, the tiles in the hall were one foot wide, so each one symbolized ten thousand miles, nicely. Once we had some reference points, we figured out where each stop would be and tied a piece of yarn to represent the place.
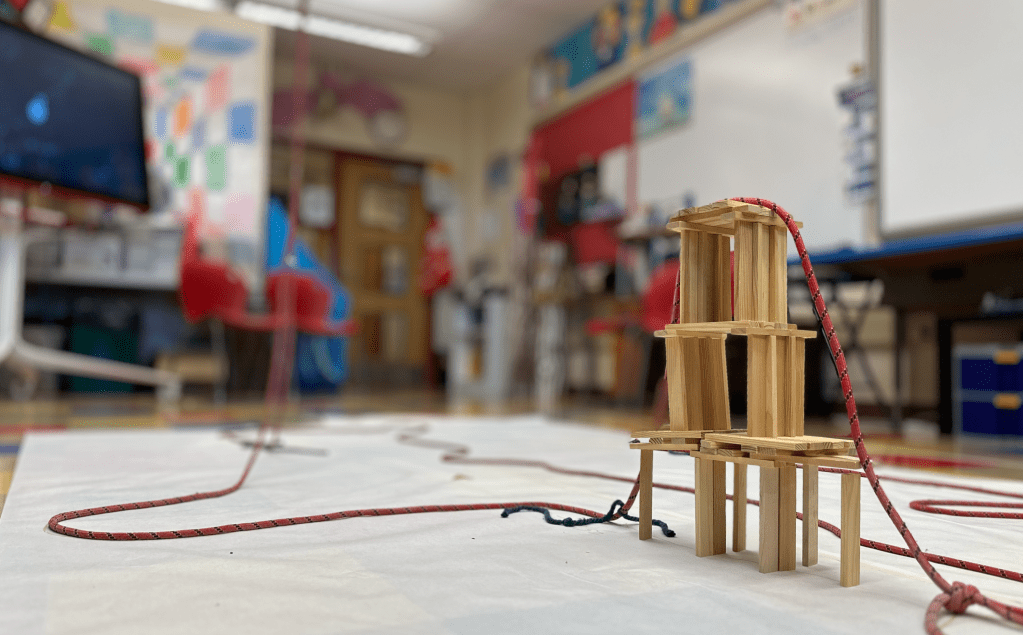
I then took one of the disproportionate maps that one of the gifted students had drawn, and I enlarged it onto poster paper that covered a large portion of the classroom floor. Next, we placed the rope showing our well-proportioned stops onto the map. We taped the pieces of yarn to the stops drawn on the map. There were huge portions of extra rope between some of the stops, and it was too short in other places.
I asked my students to “Imagine that this rope isn’t a rope, but a journey. Someone actually did travel these miles, and they traveled along the route that is represented on this map,” I told them. “How could this be?” Their first idea was that the “journey” coiled around and around; As in, the traveler had actually walked in circles. “There is a loop drawn on the map,” I pointed out. “You should assume that the line drawn on the map is the exact path the person traveled.” I wanted them to discover the concept of elevation on their own.
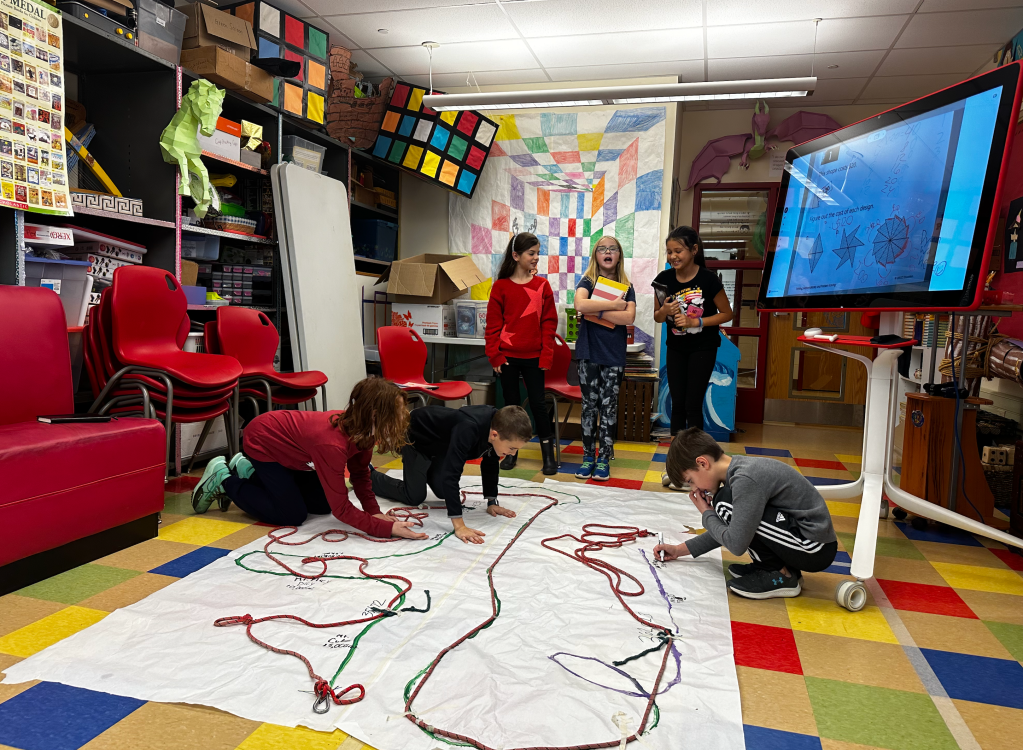
“The journey (they were very keen on calling the rope ‘journey’ and yelled at me when I mistook it for ‘rope’;) goes up!” several students shouted in unison. Feigning surprise, I encouraged my students to show it. I told them to make it happen. “Elevate the rope to show traveling up off of the paper.”
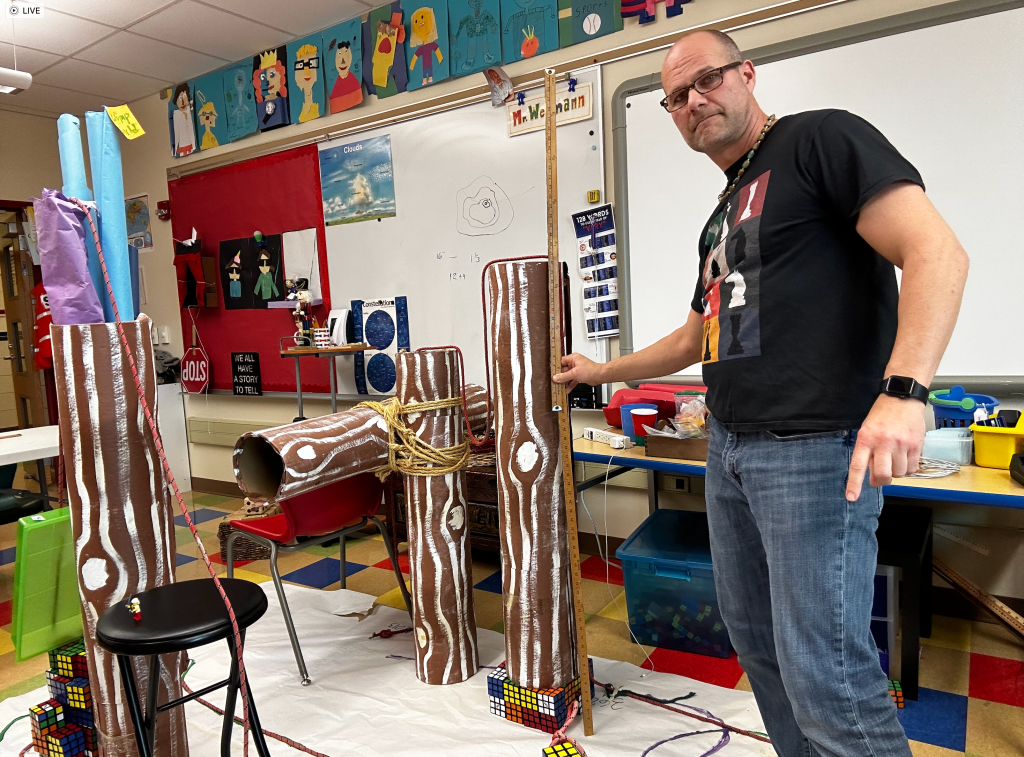
The students started grabbing everything within reach to raise their “journey” off of the paper. I gave them a few parameters: They could use anything in the room, other than my personal things. It had to follow the line of the map. The journey has to stand independently. “It can’t need you to hold it.” I heard the students mentioning how much fun this was several times, as they stacked Rubik’s cubes, built structures out of KEVA planks, and draped rope Journey over the 4’ high faux pilings I’d made for another project.
After finishing, I asked “How could we show these mountains on a two-dimensional map?” This is where topography enters the scene. Before exploring the topic, I had the gifted students brainstorm ways to display three dimensions on a flat piece of paper. They came up with drawing small images, like triangles symbolizing mountains. Information in a key was paramount. I showed them some maps that had varying colors used to illustrate elevation. They liked that idea. Finally, I introduced contour lines. These are drawn around the mountains, and show the incline of the slopes.
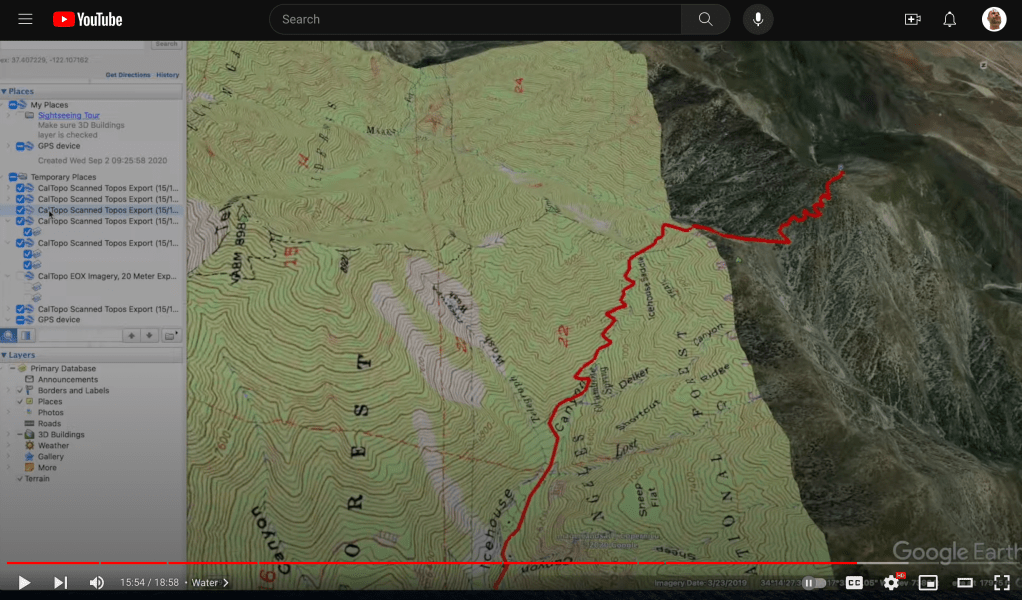
Once I did my best to explain how contour lines worked, I showed my students a video (above) made by HikingGuy.com. In the film, “Hiking Guy” takes a two-dimensional, topographical map and imports it into Google Earth Pro. He overlays the topographical map onto the exact geographical area that it represents. With Google Earth in 3D mode, the Hiking Guy swivels the view, so that you can see the depth of the mountains and valleys. We were in awe of the effects. I could have told my students that a contour interval is the amount of elevation between two contour lines on a given map, but seeing it displayed via three-dimensional modeling drove the concept home.


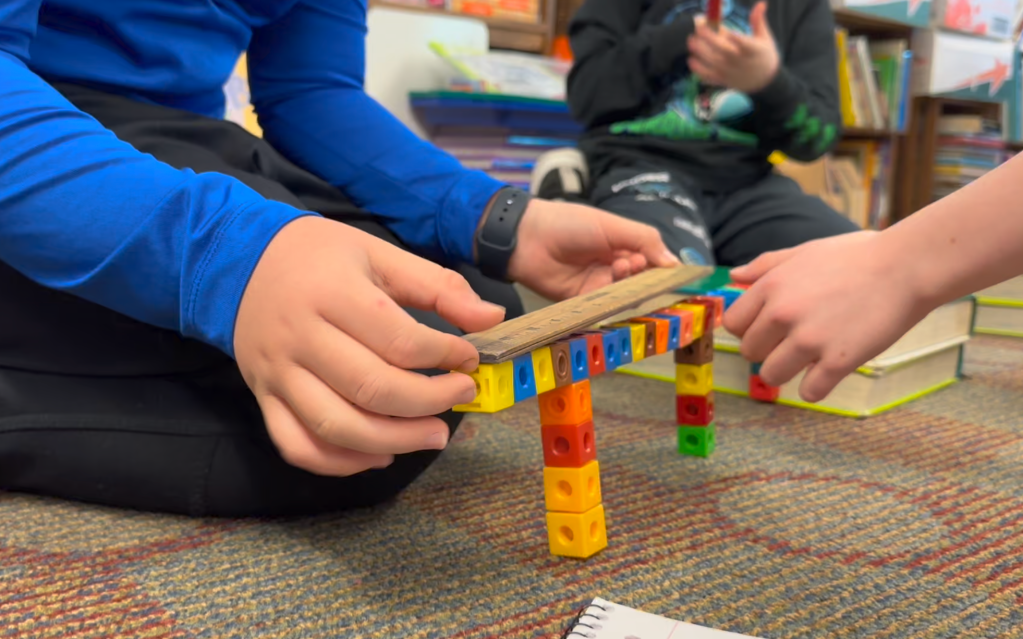
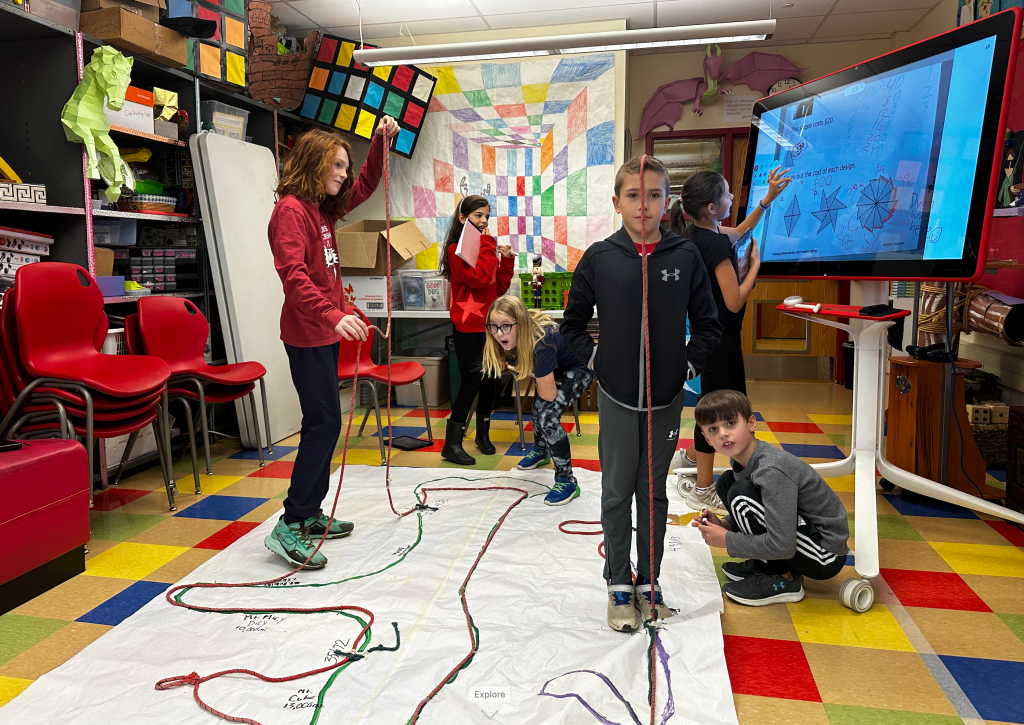
Next, it was time to collect some data to use in our map-making. We used yardsticks to measure how tall our mountains were. (I would have used centimeters as the measuring increment, in order to keep with everything scientific using the metric system, but since the Ready Math assignment had started the project off with “miles” on Zanyville, we kept to the standard system.) Before clearing away all of the materials elevating our journey, we marked the beginnings and ends of each mountain along the route on our map. In this way we would know the edges of the bottoms of our mountains for drawing contour lines.

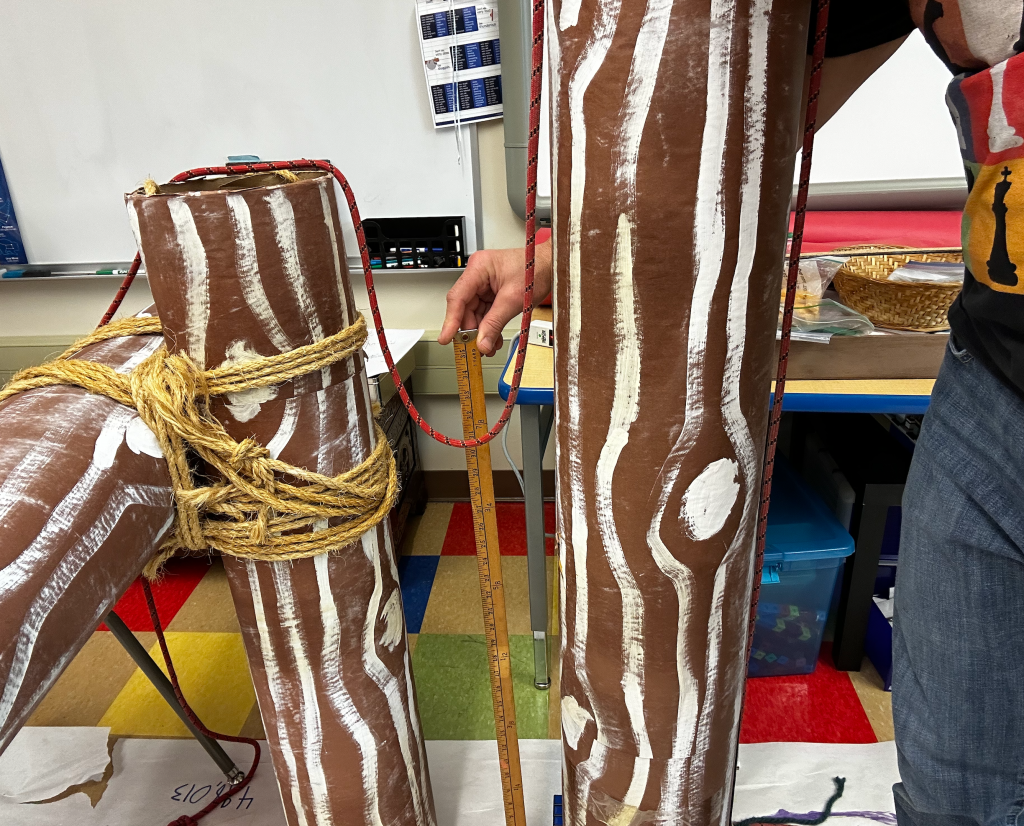

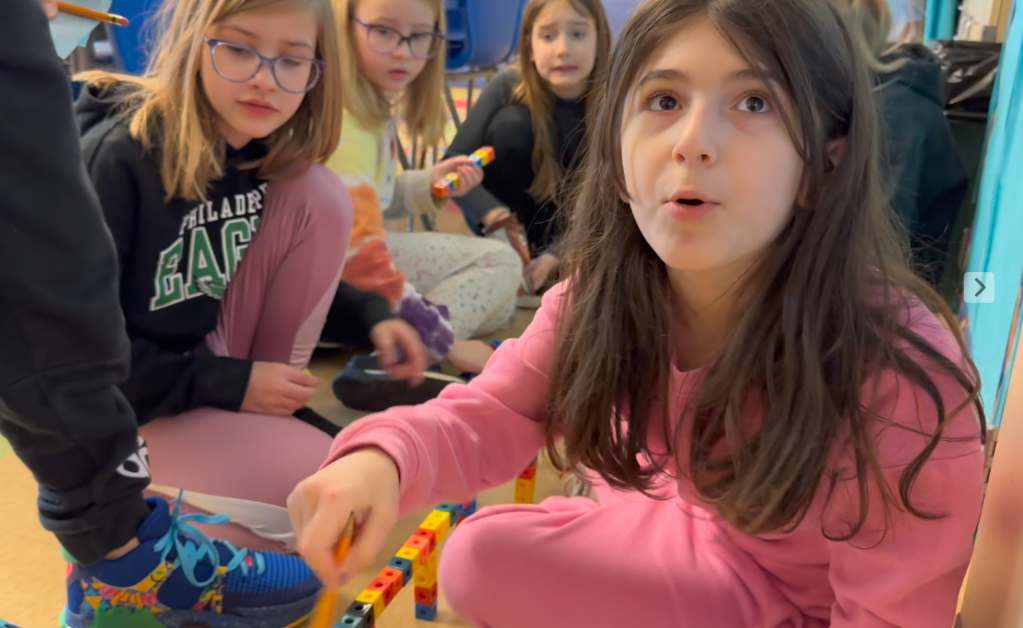
Prior to drawing our contour lines, we needed to figure out what our contour interval would be. The first thing we did was figure out the height of each mountain, according to tens of thousands of miles. If a mountain is only nine inches high, as was Mount Rubik’s (we named all of our mountains), and a foot (12 inches) represents ten thousand miles, what is the elevation of the summit? We figured out that nine inches is 3/4 of a foot, so we concluded that our nine inch mountain was 3/4 of ten thousand; or 7.5 thousand miles high. The taller mountains required us figure out how many feet fit within the total number of inches. Some rounding was used, and we came up with some valuable summit information that was transferred to the paper map.
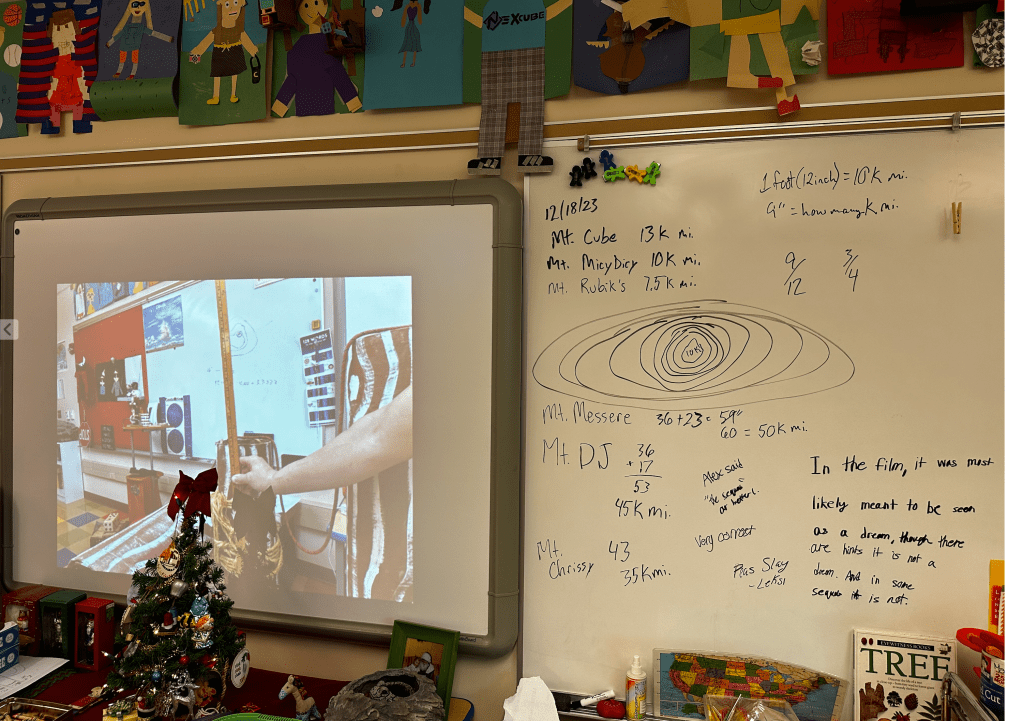

Now for our contour interval. How much elevation should each space between contour lines represent? We want the lines to be meaningful, but too many would make the map cumbersome to produce as well as read. We took each of our summits and found a number that was doable.
STEAMing Up Your STEM
Believe it or not, including art with the traditionally scientific fields of STEM has been mildly controversial. “The focus of STEM is developing rigorous math and science skills through engineering. How can you focus on other subjects (such as art) without losing the mission of STEM or watering down its primary purpose?” (Jolly, 2014). People who think this way are trying to isolate the left side of the brain (Pietrangelo, 2022). They imagine that opening STEM up to the arts would allow right-side brain activity to infiltrate and weaken STEM, but Jolly (2014) points out that this is viewing it all backwards. Art is already used in engineering, product design, creative math, and out of the box science. Strengthening our artistic use of STEM will make all four subjects so much more powerful.
Slow cookers like crock pots use lower heats to cook food over longer periods of time, deepening flavors and breaking down meat muscles, so that food becomes soft and tender (2022). A pressure cooker, on the other hand, cooks meals much faster. This mechanism has a seal that helps maintain the pressure within it. Steam builds up and pushes into the meats and other ingredients, breaking down the foods to make them tender, as well as infusing the flavors. You may not have tons of time to teach a STEM lesson. Use art to make the learning more memorable.
Saunas are small rooms that are heated up to 160 Fahrenheit. The health benefits of sitting in one of these hot beds for a short amount of time include clearing the pores of your skin, relaxing muscles, and burning calories, as well as increasing blood circulation (Hussain & Cohen, 2018). Add some water to the hot rocks in these wood-paneled spaces, and you have yourself a steam room. A steam room can help clear ones sinuses, loosen joints, and repair broken skin tissue (Johnson, 2023). [One thing to watch out for in a steam room is dehydration. It may seem ironic to dehydrate when surrounded by so much water, but the heat will cause moisture to leave ones body. Make sure to drink plenty of water and keep your time limited.] Using art in your lessons can add health benefits to your teaching. Students who favor their creative right side brain work might remember the lesson more. The artistic element could clean out misconceptions for visually-oriented students.
The difference between STEM and STEAM is as subtle as sauna vs steam room and slow cooker vs pressure cooker. I’d say that teachers are most likely using some art in their STEM lessons… I can also imagine a STEM teacher feeling pressure to utilize art which could lessen the lesson. Does titling teaching “STEAM” allow for art, promote its use, elevate art to STEM prominence, or simply point out the fact that it was there all along?
I like to think of art as the glue that holds the Science, Technology, Engineering, and Math together. I’m surprised we could see out the windows; There was so much STEAM happening in our classroom!
Enriching the Enrichment
A lesson that I began in the middle of this long mapping of a “Journey” project involved slope measurement. I thought that figuring out the value of the angles of the mountains would be useful. As it wasn’t helpful in completing the drawing of our map, I dropped it after spending only a little time on it. The information was very interesting, however, and I can foresee using it in on a slightly different angle of the lesson; Switchbacks.
Our Journey would not have gone straight up the sides of the mountains. A switchback is when a trail travels at an incline, but also more parallel than perpendicular to the mountain’s rise. After a short distance, the trail will “switch” directions and zig zag up the side of the incline. This means that the hiker will walk a much longer distance in order to get to the top of the incline, but it is an easier hike. What does this mean for our Zanyville trek? The journey, being its given length, will not go up as high; This will lower the peak or summit of each mountain. But, by how much?
Students can explore steilhangs, learning more about earth’s geography. Furthermore, they could research the differences between Earth and other planet’s geographies.
I had students conduct a scientific examination through dropping small plastic cubes on top of one another to form a miniature naturally formed mountain. They were not allowed to touch the mountain with their hands. What was the angle of elevation? We placed a ruler parallel to the side of the slope and used a protractor to measure the angle of elevation. It was about 15 degrees.
It will require some advanced geometry to recalculate the distance from the base of the mountain to the summit, given new measurements of switch back angles and lengths between directional changes. I might incorporate these elements to the lesson when I do it next year. It’s time to wrap this up.
Finally, I would like to see my students graph the elevation of the trip. Between zero miles and 498,013 miles, where did the trail rise and fall, and how much?
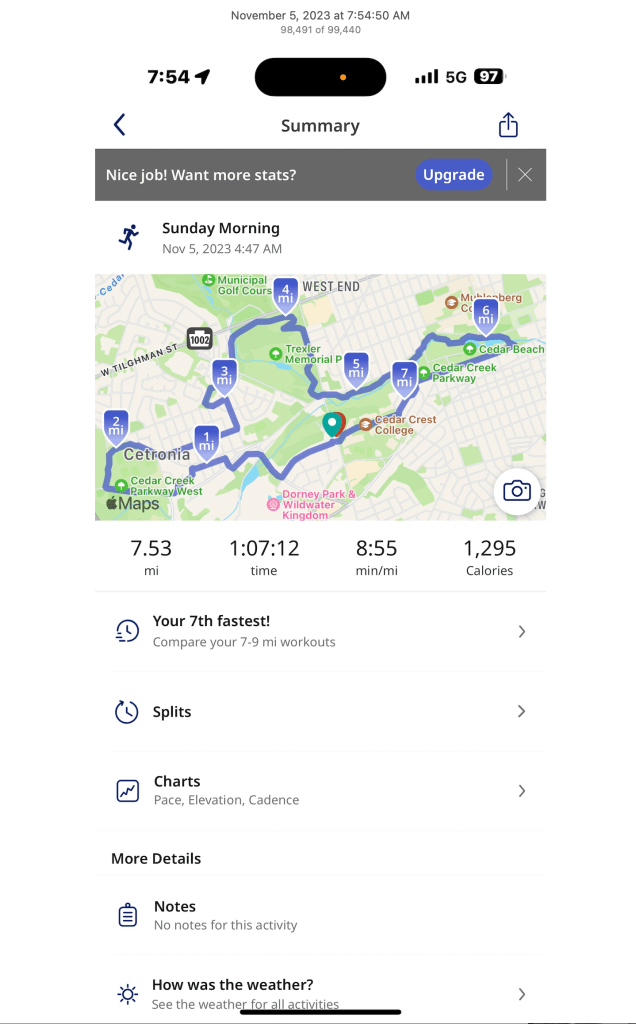

I use a running app that uses GPS to track my progress. It calls out my splits at five minute intervals. It also provides charts showing variations in my speed, cadence, and elevation. I want my students to create an elevation chart similar to the one from my running app. It ought to display where the traveler would begin and end hiking up/down mountains, as well as how high the peeks were.
Sources:
Hertz, M. (2016, February 1). Full STEAM Ahead: Why Arts Are Essential in a STEM Education. edutopia . https://www.edutopia.org/blog/arts-are-essential-in-stem-mary-beth-hertz#:~:text=In%202006%2C%20Georgette%20Yakman%2C%20a,the%20traditional%20STEM%20curricular%20areas.
Hussain, J., & Cohen, M. (2018, April 24). Clinical Effects of Regular Dry Sauna Bathing: A Systematic Review. National Library of Medicine. https://www.ncbi.nlm.nih.gov/pmc/articles/PMC5941775/#:~:text=Facilities%20offering%20sauna%20bathing%20often,%2C%20stress%20management%2C%20and%20relaxation.
Johnson, J. (2023, December 7). What are the benefits of a steam room?. Medical News Today. https://www.medicalnewstoday.com/articles/320314
Jolly, A. (2014, November 18). STEM vs. STEAM: Do the Arts Belong?. Education Week. https://www.edweek.org/teaching-learning/opinion-stem-vs-steam-do-the-arts-belong/2014/11
Pietrangelo, A. (2022, May 9). Left Brain vs. Right Brain: What Does This Mean for Me?. healthline. https://www.healthline.com/health/left-brain-vs-right-brain
slow cooker vs pressure cooker: what are the pros and cons. Farmison & Co. (2022, November 11). https://www.farmison.com/community/blog/pressure-cooker-vs-slow-cooker